Neptyne: The Programmable Spreadsheet
Neptyne
Developer Guide
Welcome to Neptyne, the platform that lets you build applications on top of the familiar spreadsheet user interface.
This guide is for the Neptyne Core spreadsheet not the Google Sheets Extension!
For Google Sheets Extension Documentation, head to our Quickstart Guide. We have a few tutorials available and more on the way, but the functionality is much more limited.
Basic
The examples in this section are taken from this Tyne.
Neptyne combines the ease of getting started with a spreadsheet with the power and extensibility of Python. Quite literally so! When you evaluate a formula in the spreadsheet you are executing Python code:
That formula in B1 adding up the numbers in A1:A3, looks like an Excel/Google Sheets formula. Neptyne supports most Excel formulas but they are implemented in Python. Here we use AVERAGE(A1:A3) which is a python implementation of the Excel formula. We could have entered sum (A1:A3) / len (A1:A3) and have accomplished the same thing. In general you can mix and match Python functions and Excel formulas as you like.
The other thing to note here is that we’re talking about an extended version of Python where you can refer to the cells in the spreadsheet directly without any complicated API. We can observe this easily in the REPL section in the lower right corner where we can quickly evaluate any expression or execute a command:
B1 looks like a python variable, but it returns the value of the cell B1. And A1:A3 behaves like a list, so we can loop over it and use it in a list comprehension.
And it works both ways! We can directly change the values of the sheet from the command line:
Which will result in:

Like Google Sheets but unlike Excel, Neptyne supports “infinite” ranges. A2:A will return a cell range starting at A2 and going down until the last cell in the A column that has a value. This is rather useful when we don’t know how much data there is.
Handling multiple sheets
By default all references from the REPL or code panel resolve to the first sheet. It is good practice to use the first sheet to show a summary of what’s going on. Other sheets can then be used to store larger amounts of data.
You can use the UI to add or rename sheets and then access them from code using the “!” operator as you would in other spreadsheets. So B1 and Sheet0!B1 are equivalent:
There is an extensive API to manipulate multiple sheets
After this we can access the new sheet directly using FastAnimals!A1. See the section below for the full sheet api.
Spilling
Spilling happens when a cell evaluates to an iterable value that spills out into neighboring cells. Both Excel and Google Sheets have this, but it is not as much a core concept as it is with Neptyne.
For example to calculate the numbers 1 to 5 doubled, we can put in A10 the formula [=range(1, 6)] - a python expression returning the numbers 1 to 5 and in B10, simply [=A10:A14 * 2]:
Putting a formula in a cell that returns more than one number just fills in the cells below, so that’s what’s happening with A1. In B1 we take the range A1:A5 and multiply it by 2. You can’t really do this in other spreadsheets, but remember our language is an extended version of Python. A1:A5 returns a CellRange, which is a Python object that behaves like a python list but also implements basic math operators like + and *. These operate on each element. In this example each value in A1:A5 is multiplied by 2. If we multiply two CellRanges of the same size, the multiplication is done pairwise. If you’ve ever worked with numpy, the broadcast rules of numpy apply here.
If a formula returns a two dimensional array, the values spill in both directions. For example:
The list comprehension here returns a list of lists that gets spilled out as a two dimensional array. Each element is a smiley character since chr(ord('😊') + x + y * 5)will return a character from the unicode table counting from the first smiley face.
Spilling also works when writing to a cell. Writing a list to a cell will also affect the cells below. Writing a list of lists to a cell will set the values of a block of cells. We can import a table from the wikipedia into our sheet like this:
Which will result in data about the fastest animals in our newly created sheet starting at A1:
There is an important difference between the two approaches. Writing a formula into a cell that spills into other cells, keeps the formula in that cell while the cells it spills into do not have a formula - they are all calculated by that same formula. If we change the formula any or all of those cells might change. If the new formula returns more or less values than before, the number of cells spilled into will increase or decrease.
Writing to a cell from the notebook using the imperative API changes whatever it says in the cells written to. There is no difference between writing using code or editing the cells directly.
Writing functions to extend the spreadsheet
Examples can be found here: https://neptyne.com/neptyne/c90dgfw9iv
So far we’ve interacted with the spreadsheet using the command line interface. This works well for ad-hoc data manipulation or for instant querying of data. For more permanent and reusable code. For example, let’s say we’d want to use the binance API to get access to crypto currency values. We can simply type in the code panel:
After this we can use the new function immediately in the spreadsheet
Accessing ranges as tables
Cell-ranges behave like a list or a list of lists if the range is two dimensional. We can loop through it like we can with normal Python lists. We can also write to the range and this will write to the underlying values in the spreadsheet. Cell-ranges are bounds checked - you can only modify values inside the range.
Treating a section of a spreadsheet as a separate table is a common pattern and Neptyne exposes a number of methods to make these scenarios easy to manage.
By using the code from the previous section and just adding one method:
We can now add a row to our virtual table from A2:B10 by just typing into the command line interface:
And we can do this any time we want to record the price. In the sections below you can learn how to collect information on an interval or as a result of a button click, which would make this example even more useful.
Below is a full list of the supported table APIs.
data can be used to specify data to insert. Multiple rows will be inserted to match the shape of data is multidimensional. Almost all values will work for data, try a string, list, dictionary or a dataframe!
amount can be used to specify the number of rows to insert explicitly, but defaults to 1.
Existing entries in the table will be shifted down, and nothing outside of the range will be modified.
Returns a cell-range containing the data inserted.
amount defaults to 1
by_column can be specified as an int or sequence of ints to specify the column(s) to sort by.
on_range_change is a boolean that swaps the sort order.
key can be used as an alternative to by_column. It matches the signature of python's built in sort to run the key function on each row prior to sorting.
Cell API
Apart from just changing the values of cells, we can also interact with them in a number of other ways. See https://neptyne.com/neptyne/qspxs2cy6x for an illustrative example.
Here we create a little function that takes a cell range and sets the colors of those cells to a random value. When we run it from the command line with for example:
We get a nice little pattern:
Note that we can also set the background color of an entire range in one go using A1:C6.set_background_color(255, 255, 255)
Neptyne supports the following access methods:
Input Widgets
Spreadsheets are a pretty good way to input data, but there are times when you need something more. Input widgets make it possible to execute python code based on user interactions in the spreadsheet. Currently Neptyne supports buttons, dropdowns, sliders, checkboxes and autocomplete. Input Widgets are Python objects and can be directly instantiated from the editor.
Every widget takes an optional event handler parameter. This is a function that gets called when the widget is triggered with the value of the widget if the widget has a value (a button doesn’t).If an event handler declares an extra argument, it will be called with an event object. This event object has three fields:
Every widget takes an optional event handler parameter. This is a function that gets called when the widget is triggered with the value of the widget if the widget has a value (a button doesn’t).If an event handler declares an extra argument, it will be called with an event object. This event object has three fields:
- cell: the cell where the widget is defined. This is useful if you have one event handler that is triggered by different widgets.
- user: information about the user that triggered the event.
- time: the spreadsheet time of when the event happened
Button
See: https://neptyne.com/neptyne/lpayrwpwbpButtons are the simplest widgets. They take just a caption and an event handler in their constructor. If you omit the caption, it will default to the name of the event handler.
Clicking the button in A1 triggers the click event, which is defined in the notebook
So this is a little app that changes “hello” into “world” and back again!
Buttons are often used to start a possibly longer task and so you might want to indicate that they are "busy". To do this, you can set the property is_working to True. When you do that, a small spinner appears on the button.
Dropdown
See: https://neptyne.com/neptyne/cb0ng0rrmzDropdowns let you pick a value from a list. When you do, the event handler is called with the value you picked.
The drop sources its values from C1:C4 and the pick function is called when a new value is selected. The pick method updates the B1:B4 column using the table api for cell ranges described above:
Every time the dropdown updates we check the rows from B1 to C4 and if the last element of the row corresponds to the value picked, change the first element to “X”
Slider
See: https://neptyne.com/neptyne/uxoqiupwk2 A slide returns a number between 0 and 100, depending on where it sits. We can use it to create a very simple image resizer:
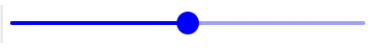
The slider in B1 has a definition of:
So in this case we don’t have an event handler. Instead the formula for the image in A3 is tied to B1.value - the value of the slider. Since the normal spreadsheet rules apply, any time we change the slider, the image will also be resized.
Checkbox
See: https://neptyne.com/neptyne/nxb3cu3cb6 A checkbox is either checked or it isn’t. Useful to make a selection out of a list. For example:
Any time the checkbox changes value, check is called with that value. We can use that value, but in this case all 5 checkboxes have the same handler. Instead of looking at the event value, this function just peeks at the values in A2:A6
That way C1 always has the values we checked comma separated.
Output Widgets
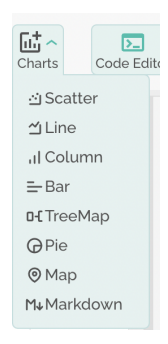
Neptyne comes of course with a set of powerful visualization tools we refer to as charts. You can access them from the chart menu right on the top.
The easiest way to get started is just to pick the chart you want and use the interactive editor to get the formula in the cell where you want the chart to appear. For reference purposes, here’s a list of some visualizations and what they do:
Higher level functions
There are a number of higher level functions to round out the app building functionality. To get started add
To the top of your code. You now have access to the following utility functions:
Sheets API
nt.sheets offers access to the general sheets API and behaves like a collection of sheet objects. You can iterate through it with a for loop:
Or access the individual sheets with the [] operator - either an id or name will do. del sheet [name] will delete a sheet. You can rename sheets by changing the name property directly, but there is currently no way to adjust the order of sheets.
The sheet objects have a sheet_id and a name - the sheet_id is stable, the name is not. Other than that, they behave like cell ranges. So another way to set A1 to “Hello world” would be:
Row Column API
In addition to accessing values, nt.sheets can be used to select entire rows or columns and modify their attributes. Here are some examples:
Keep in mind the rows/columns still act as cell ranges. The below snippet can be used to set the value of B1 since it's the top left element of this selection of columns. This also means that all table APIs are supported.
The main use case of rows/columns in addition to selecting entire rows of data is to modify their properties. For example, the below code snippet can be used to set the width of the first two columns to 200 pixels
The following functions are available on rows and columns
Conditional Formatting
Neptyne supports conditional formatting by using the on_value_change and on_range_change decorators. Check out this example https://app.neptyne.com/-/icmc1knnih.
For all values in the range A1:A4 and in the cell A8, if they are strings the background color will be set to green, otherwise set to white. The set to white step is important to clear the formatting from cells that previously contained a string! The function green_strings will run on each cell in the range every time the code panel is updated, or any value in that range is modified.
Sometimes however, you want to apply the formatting based on other rows in the selection. For example, this function bold_max bolds the row that contains the max value in the first column.
When using on_range_change, the function will run on the entire cell_range in the decorator rather than individually on each cell. The first part of the code loops through each row and computes the max_index, and the second applies the formatting. You can see in the above image that the elements in C4:D4 are bolded because C4 contains the max score of 7.
Timed Cells
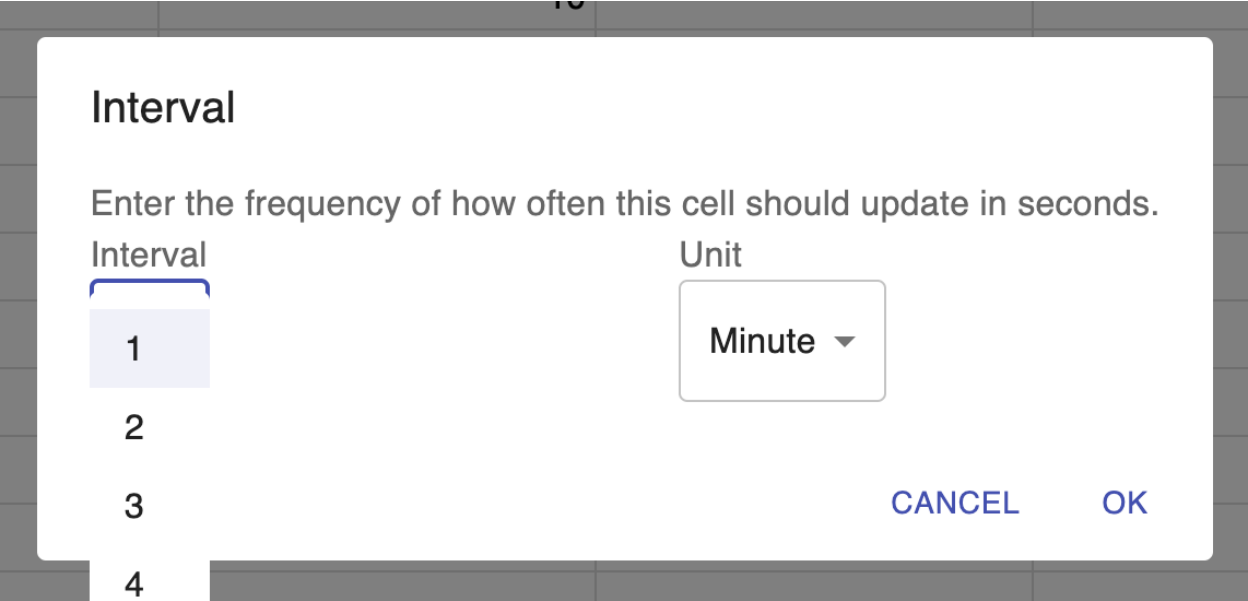
In a “normal” spreadsheet a cell only needs to be recalculated when its inputs change. In Neptyne there can be a number of reasons why you’d want to recalculate a cell anyway; maybe it depends on an external data source that might have changed. Maybe you want to do some bookkeeping. To make this possible, Neptyne cells support timed execution.
Have a look at this tyne: https://neptyne.com/neptyne/ojfhuuddd6
The sheet is filled with random emojis:
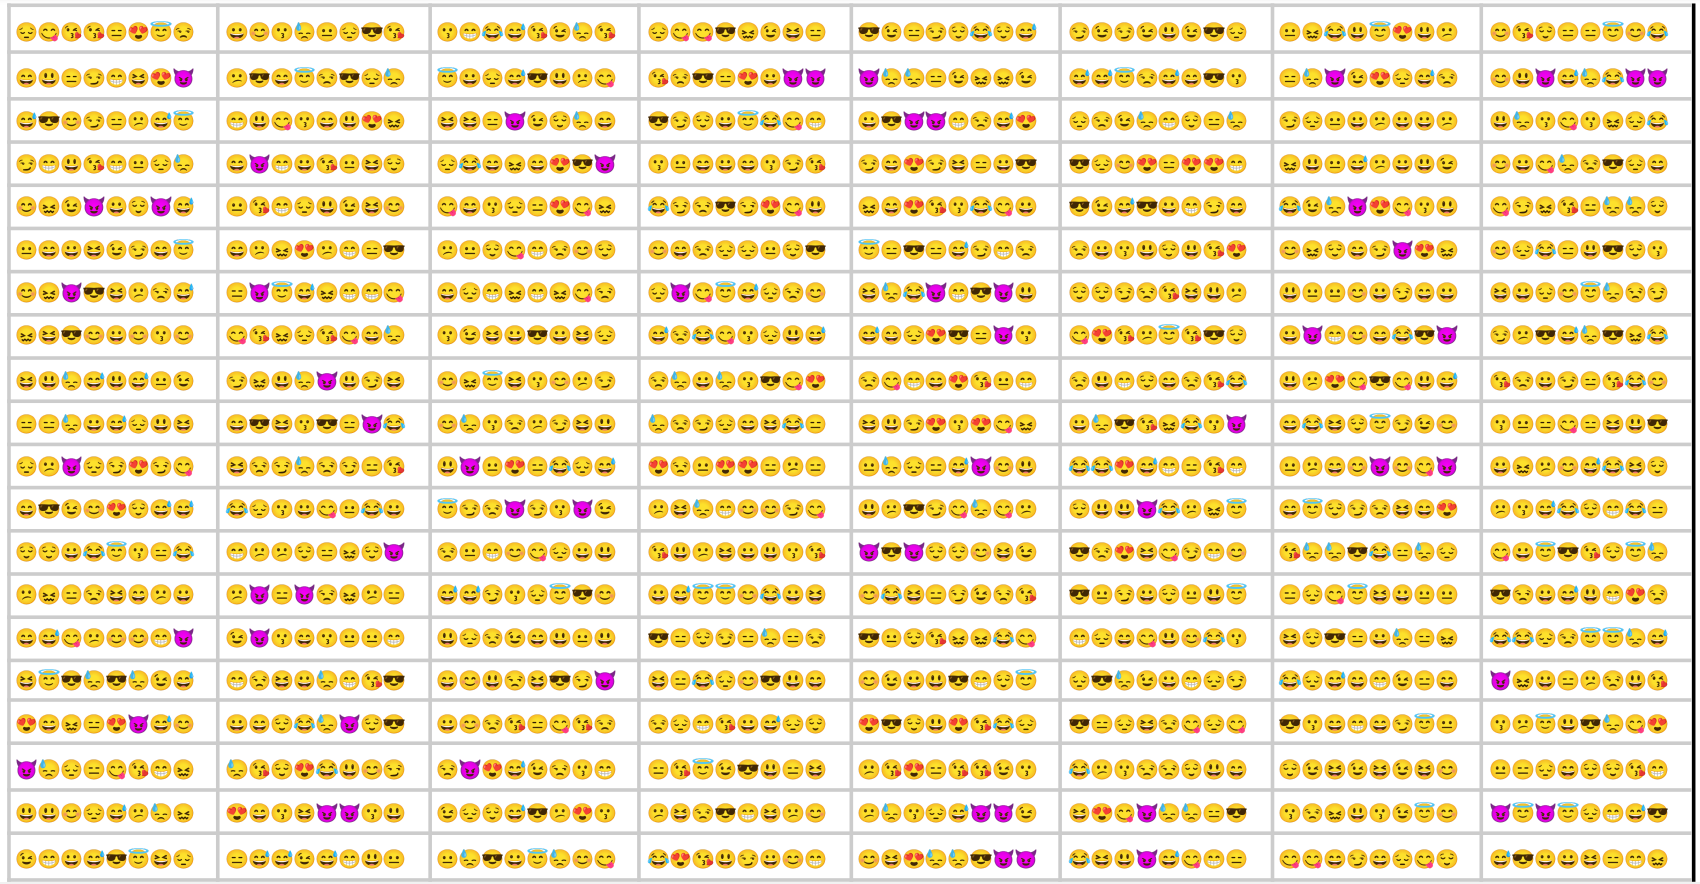
This is done with the code below:
If you look at the sheet long enough (15 minutes!), you see that the emojis change! This accomplished by the code in cell A1:
Writing to a cell from the notebook using the imperative API changes whatever it says in the cells written to. There is no difference between writing using code or editing the cells directly.
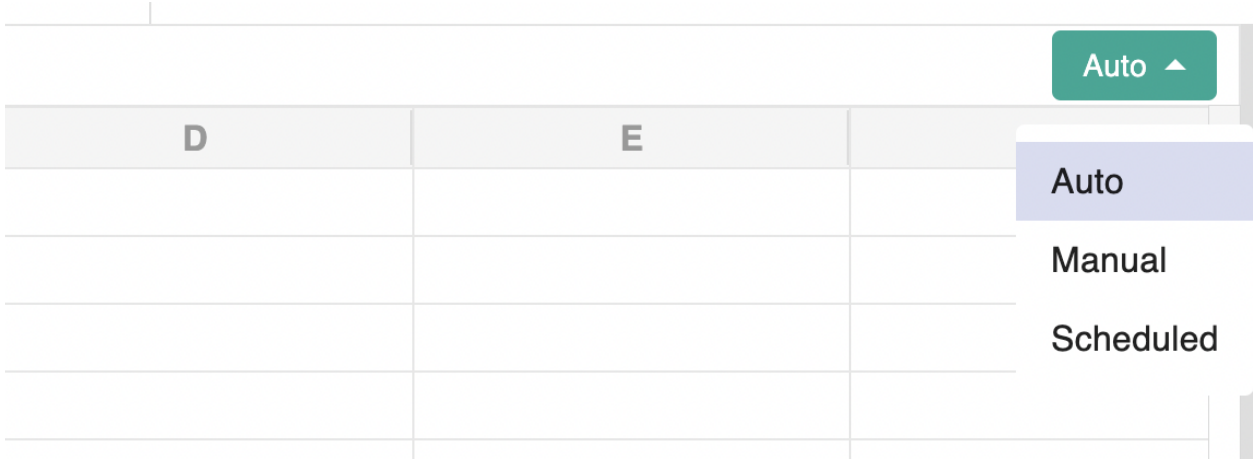
And then picking the desired update frequency in the next dialogue: